400m on the track
One of the applications the MSX system is intended for is monitoring athletes on the track, in particular over the 400 metres, recording data at 100 Hz. It is a typical "special" use case where the high rate is not just useful but necessary.
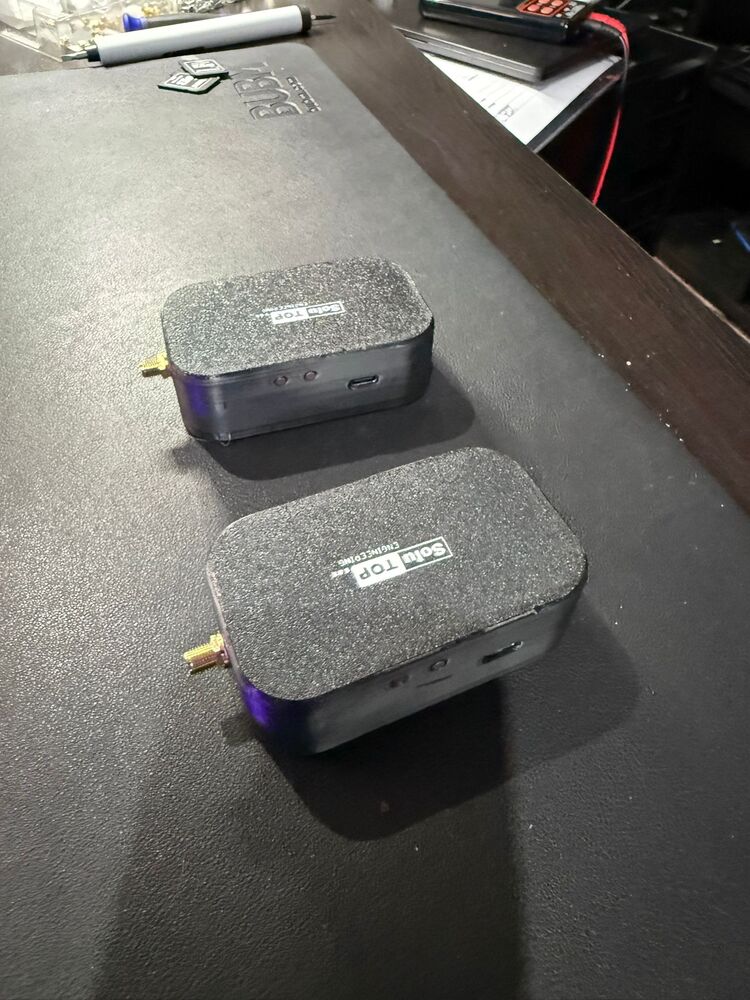
The MSX unit for the field
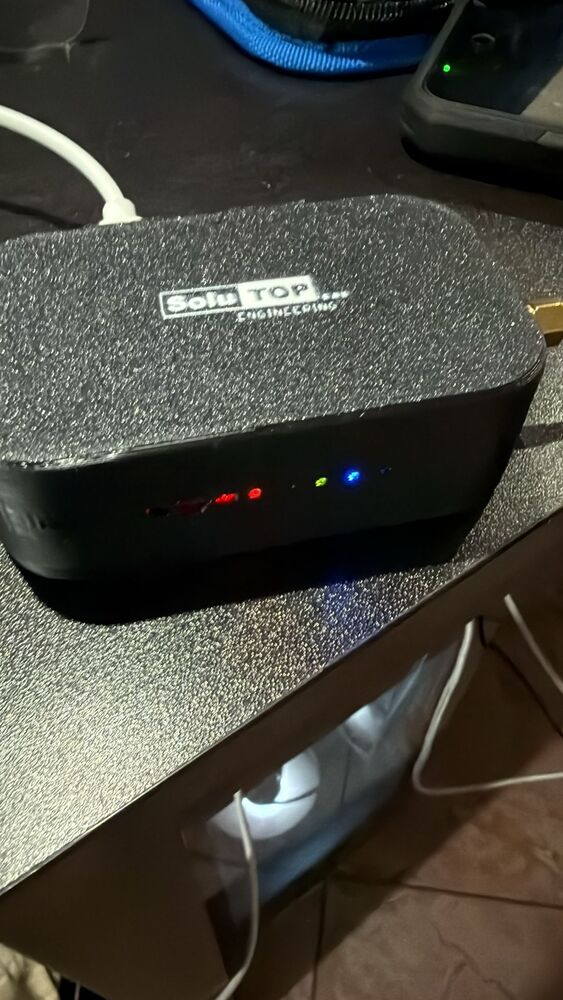
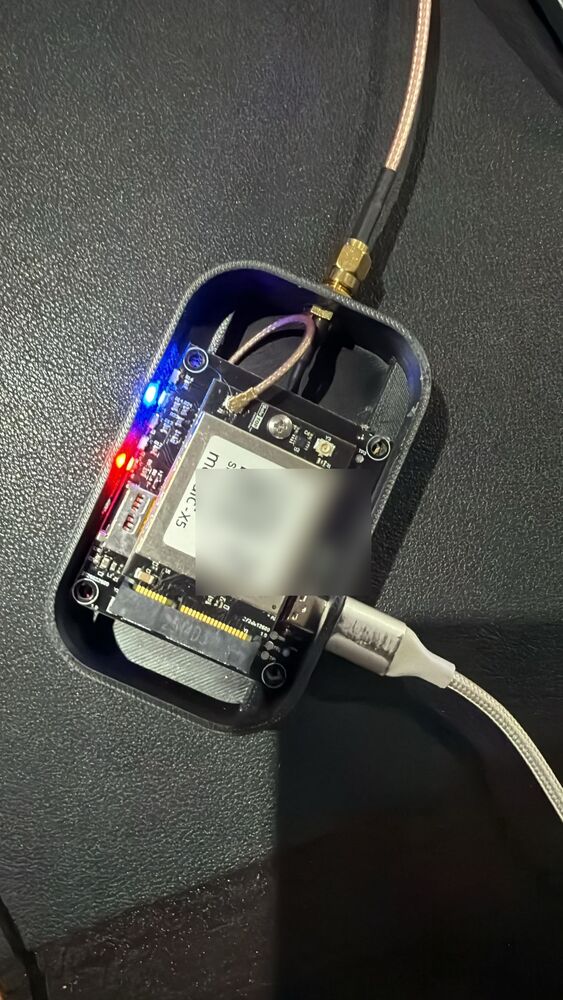
For track use the MSX is housed in a compact enclosure (Main + mini carrier). On the outside there are only the SMA antenna connector, the USB-C for power and data, the two buttons (Reset and LOG) and the status LEDs on the front.
Why 100 Hz is needed in sprinting
A 400 m runner moves at high speed (on average ~8–9 m/s, with peaks around 10 m/s on the fast sections). At these speeds a low rate "misses" the dynamics of the movement:
| Rate | Sample every | Distance between two samples at ~9 m/s |
|---|---|---|
| 1 Hz | 1000 ms | ~9 m → too sparse, "chopped" trajectory |
| 10 Hz | 100 ms | ~0.9 m → fine for the track, poor for the dynamics |
| 100 Hz | 10 ms | ~9 cm → high-resolution trajectory and speed profile |
At 100 Hz you get a sample every ~9 cm of running: dense enough to faithfully reconstruct the bend, the stride and the rapid speed variations.
What it lets you measure
With centimetre-precision position (obtained in PPK post-processing) sampled at 100 Hz you can derive, for each instant of the race:
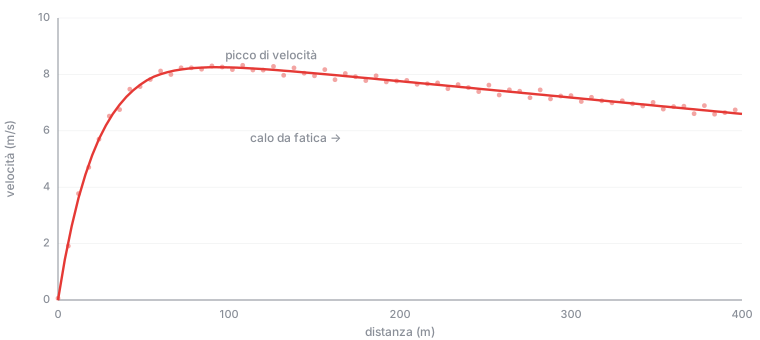
- instantaneous speed (derivative of position) → speed curve over the lap;
- acceleration and deceleration → initial launch phase and the slowdown in the final 100 m (typical of the 400 m);
- actual trajectory versus the ideal lane line → metres actually run, "widening" on the bends;
- split times every 100 m / 200 m / 300 m derived from position, without photocells;
- bend handling → entry/exit speed, radius taken;
- effort distribution along the lap (pacing).
Why RTK corrections + 100 Hz together
- the RTK corrections (NTRIP) and PPK post-processing give the spatial precision (centimetres): without them you could not distinguish the lane or the small trajectory deviations;
- the 100 Hz gives the temporal resolution: without it you would lose the rapid speed and acceleration variations.
You need both: high precision and high rate.
Note
The centimetre precision for the 400 m is obtained in post-processing (PPK) on the logged raw data: an RTK fixed real-time solution is not required (that is only needed in static surveys).
Recommended setup
| Parameter | Recommended value |
|---|---|
| Mode | RTK (corrections over USB / NTRIP – see USB operation) |
| SBF logging rate | 100 Hz (msec10) – see Raw data |
| SBF blocks | MeasEpoch + PVTGeodetic (+ ephemerides) for position and PPK |
| Constellations | multi-constellation for robustness on bends and with the athlete's body |
| Antenna | lightweight active antenna, mounted high (e.g. on the back/helmet) under open sky |
Note
A 400 m race lasts ~45–50 s → at 100 Hz about 4500–5000 epochs: an SBF file of a few MB, perfectly manageable.
Receiver configuration file
To avoid re-entering the settings by hand on every receiver, the mosaic-X5 can be
provisioned with a boot configuration file: you load it once (via the
Septentrio web UI, Admin → Configurations, or via commands) and from then on the
receiver starts up already set. The file contains only the differences from the
factory configuration (RxDefault) and includes the full SBF logging on DSK1.
# COMPLETE mosaic-X5 configuration - exported 2026-06-16
# Includes SBF logging on DSK1. Load it as the Boot configuration.
# (only the differences from the factory RxDefault)

  setDataInOut, USB1, CMD
  setDataInOut, USB2, CMD
  setDataInOut, DSK1, , none

# --- SBF logging on internal disk DSK1 (1 Hz) ---
  setSBFOutput, Stream1, DSK1, MeasEpoch+MeasExtra+EndOfMeas+OutputLink+GPSRawCA+GPSRawL2C+GPSRawL5+GLORawCA+GALRawFNAV+GALRawINAV+GALRawCNAV+GEORawL1+GEORawL5+GPSNav+GPSAlm+GPSIon+GPSUtc+GLONav+GLOAlm+GLOTime+GALNav+GALAlm+GALIon+GALUtc+GALGstGps+GALAuthStatus+AttEuler+GEONav+GEOAlm+BaseVectorGeod+PVTGeodetic+PosCovGeodetic+DOP+EndOfPVT+GPSCNav+BDSCNav1+BDSCNav2+BDSCNav3+NavICLNav+ExtEvent+DiffCorrIn+BaseStation+InputLink+ChannelStatus+ReceiverStatus+ReceiverSetup+Commands+Comment+BDSRaw+LBandTrackerStatus+IPStatus+QZSRawL1CA+QZSRawL2C+QZSRawL5+PVTSupport+LBandBeams+BDSAlm+BDSNav+QualityInd+NTRIPClientStatus+DiskStatus+NTRIPServerStatus+RFStatus+NAVICRaw+QZSNav+QZSAlm+RxMessage+DynDNSStatus+PVTSupportA+Meas3Ranges+BDSIon+BDSUtc+LBandRaw+BDSRawB1C+BDSRawB2a+P2PPStatus+BDSRawB2b, sec1

# --- NMEA output on USB1 (1 Hz) ---
  setNMEAOutput, Stream1, USB1, DTM+GBS+GGA+GLL+GNS+GRS+GSA+GST+GSV, sec1

# --- PPS: 1 Hz, rising edge, 100 ms pulse ---
  setPPSParameters, sec1, Low2High, 0.00, GPS, 60, 100.000000

  setFileNaming, DSK1, Incremental

# --- User account (see warning below) ---
  setUserAccessLevel, User1, admin, Mosaic2026!, User
What the commands do:
| Command | What it sets |
|---|---|
setDataInOut, USB1/USB2, CMD |
Puts the two virtual USB ports in command mode (configuration and data over USB). |
setDataInOut, DSK1, , none |
On the disk (DSK1) no input stream: it is a logging target only. |
setSBFOutput, Stream1, DSK1, …, sec1 |
SBF logging to disk with the full block list (raw measurements, ephemerides of all constellations, PVT, status) at 1 Hz (sec1). |
setNMEAOutput, Stream1, USB1, …, sec1 |
NMEA stream on USB1 with the GGA, GNS, GSA, GST, GSV… sentences at 1 Hz. |
setPPSParameters, sec1, Low2High, 0.00, GPS, 60, 100 |
PPS once per second, rising edge, GPS time scale, 100 ms pulse → reference to sync other sensors. |
setFileNaming, DSK1, Incremental |
Incremental log file names on disk (log__000.sbf, log__001.sbf…). |
setUserAccessLevel, User1, admin, …, User |
Creates the user account admin with the password and access level. |
For the 400 m: raise the SBF logging to 100 Hz
In this file the SBF logging is at 1 Hz (sec1). For the 400 m trials change
sec1 to msec10 (= 100 Hz) on the setSBFOutput line (or set 10 msec
in the stream from the web UI). The NMEA stream can stay at 1 Hz: it only
feeds the real-time monitor.
Plaintext credentials — change them immediately
The last line sets the user account with plaintext credentials:
- Username:
admin - Password:
Mosaic2026!
These are the default credentials: change them immediately after first
login (Admin → User Administration menu). Since this is a public guide,
anyone who reads them can log into the web UI of an MSX that still has them
active: changing them is the first security step. On a new receiver you can also
start from the Septentrio factory credentials (RxAdmin / S3pt3ntr10).
Step-by-step configuration for the 400 m
This is the complete procedure, from inserting the microSD to recording on the track. Follow it in order: at the end the receiver is ready and records at 100 Hz to the card by pressing the LOG button.
What you need
- assembled MSX (Main fitted into the mini carrier — see Assembly);
- a microSD card (recommended class 10 / U1 or higher, formatted FAT32) with free space;
- a multi-band GNSS antenna with cable;
- a USB-C cable + power supply (5 V / 2 A) or a PC for the configuration;
- access to an NTRIP corrections service (caster, mountpoint, credentials).
1 · Insert the microSD (before powering on!)
With the receiver off, insert the microSD into the carrier's CN1 slot
(push until the push-pull mechanism clicks). It is the slot next to the
mini-PCIe connector — see Carrier mini → Connectors.
The microSD must be inserted BEFORE powering the system
The mosaic-X5 module detects and mounts the disk only at start-up. So the microSD must be already inserted before you connect the power: only then, at power-on, does the microSD green LED turn steady, confirming the disk has been mounted and is ready for logging.
microSD green LED behaviour:
- steady → disk mounted and ready for logging;
- blinking → recording in progress (after the 1st press of the LOG button);
- off → disk not detected.
If you power the system without the SD (or insert it while already powered), the green LED stays off and logging will not start: in that case power off, insert the SD and power on again.
Note
Use an empty microSD formatted FAT32. The log files are created
automatically in the DSK1/SSN folder with incremental names.
2 · Connect and power
Connect the antenna and then the USB-C cable to the PC (or power supply). At start-up the LEDs show the status (see Carrier mini → LEDs and states).
3 · Open the web interface (RxWeb)
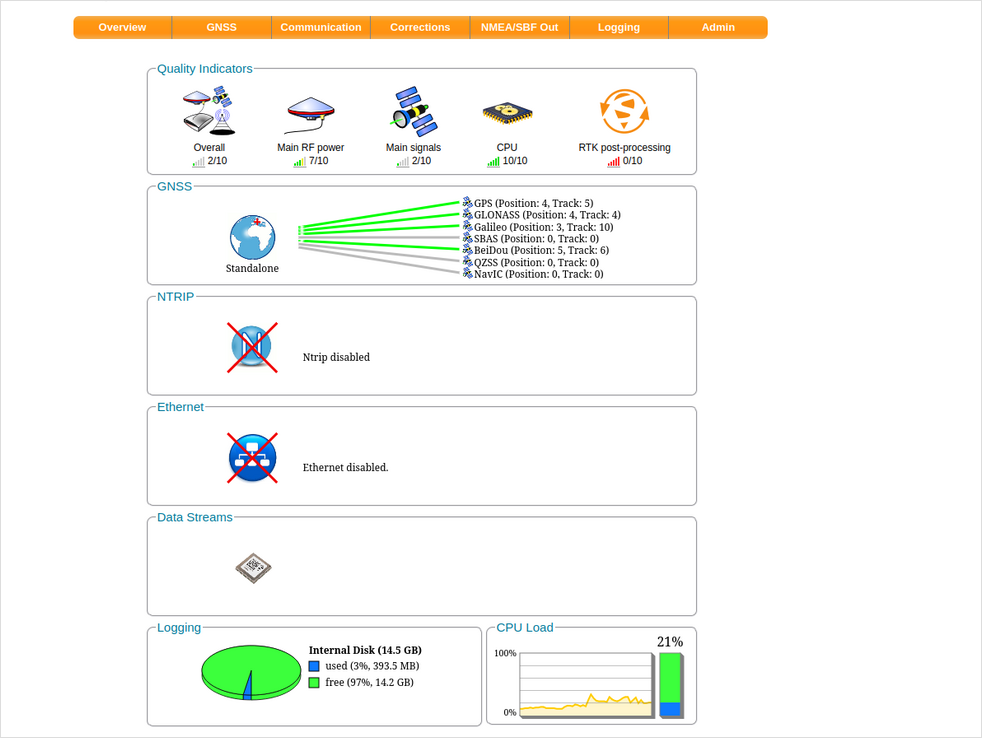
From a PC connected over USB, open the browser at http://192.168.3.1: the
Septentrio web UI (RxWeb) opens — the original interface with its
characteristic orange theme. The top bar has the Overview · GNSS ·
Communication · Corrections · NMEA/SBF Out · Logging · Admin menus.
Login credentials — change them immediately
The interface requires a login. Default user: admin. Change the user
and password immediately on first login (Admin → User Administration
menu): the guide is public and anyone who knows the credentials could log into
the web UI of an MSX that still has them active.
4 · Set the RTK corrections (NTRIP)
The RTK corrections are set from the Corrections menu: open the NTRIP client configuration, press New and enter the caster (host:port), mountpoint, username and password of your service; enable sending GGA for VRS networks, then confirm. In the Overview the NTRIP status goes from Ntrip disabled to connected: the receiver receives the corrections. The centimetre precision for the 400 m is obtained anyway in post-processing (PPK).
Info
The RTK corrections always come only from an external NTRIP client (over USB/Internet) — see USB operation.
5 · Prepare the SBF stream at 100 Hz (General tab)
Before you can record you must define the logging stream. Open the Logging menu, General tab: in the NMEA/SBF Logging Streams box press New SBF stream.
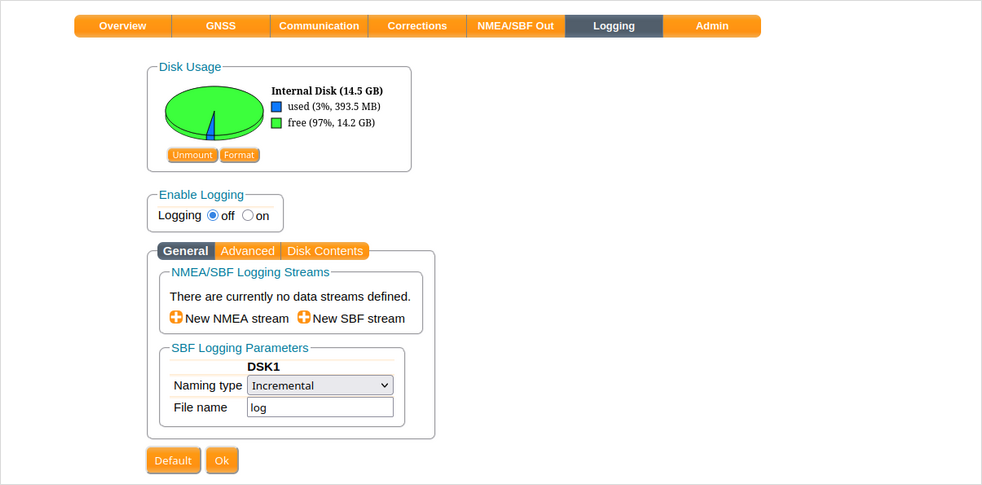
The Edit SBF Stream window opens. Here:
- set Interval to
10 msec(= 100 Hz) — the default is1 sec, i.e. 1 Hz; - tick PostProcess: it automatically selects all the blocks needed for post-processing (raw measurements, RawNavBits, ephemerides of all constellations). Also tick Rinex if you want to enable RINEX export;
- with Detailed selection you can view and tweak the individual blocks;
- confirm with Ok.
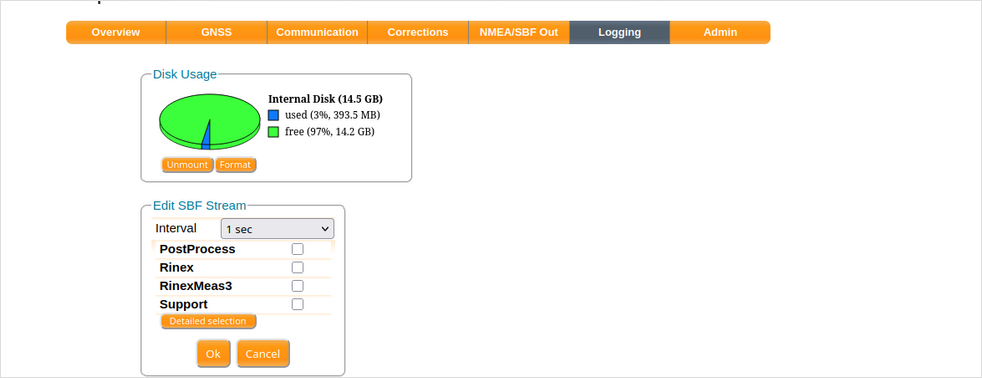
10 msec = 100 Hz) and the PostProcess preset for the PPK blocks.Warning
Choose 10 msec (100 Hz), not 100 msec (which is 10 Hz). It is the most
common mistake. Details in Raw data → How to set 100 Hz.
What PostProcess selects (Detailed selection)
Pressing Detailed selection shows the blocks enabled by the PostProcess preset: Measurements, RawNavBits and the ephemerides of GPS, GLO, GAL, GEO, BDS, QZSS. These are exactly the data the PPK needs.
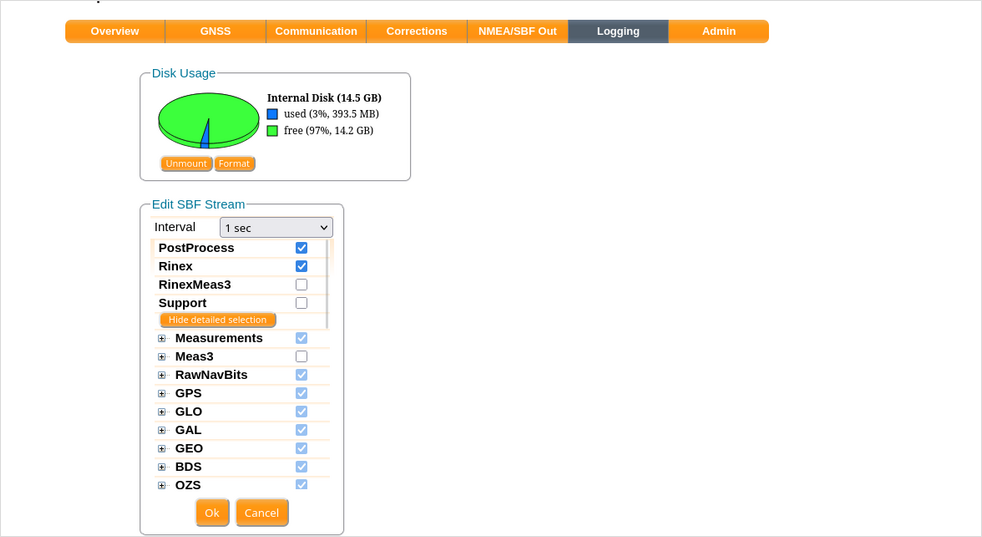
Back on the General tab, the stream appears in the list (Type SBF, Messages
PostProcess+Rinex…). In SBF Logging Parameters leave Naming type =
Incremental and File name = log (files will be log__000.sbf,
log__001.sbf…). Press Ok to apply: "Streams prepared, press OK to apply the
changes" appears.
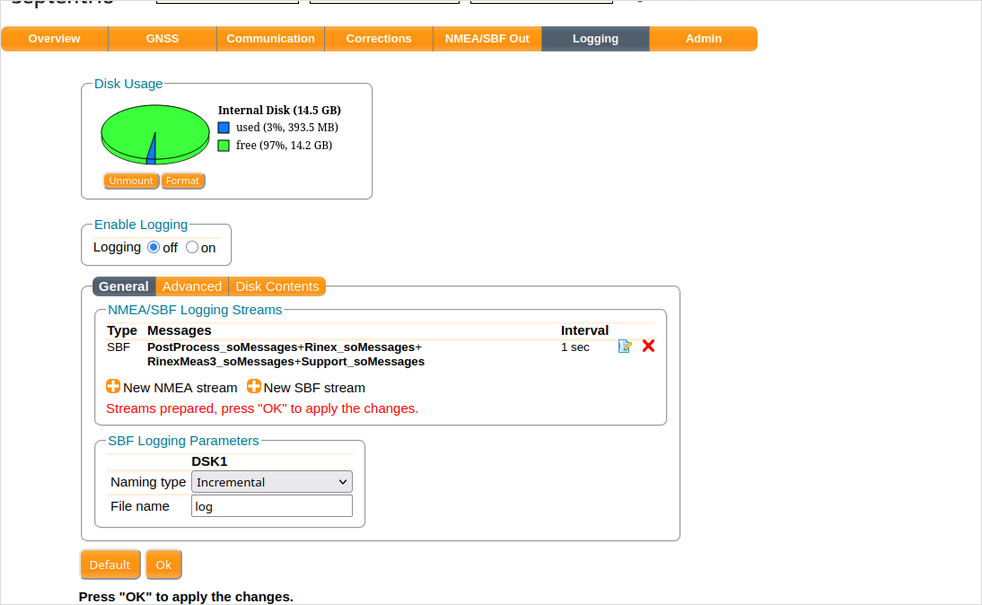
6 · Save the configuration as Boot
Go to Admin → Configurations and copy Current → Boot: this way the configuration (NTRIP + SBF stream at 100 Hz) stays active after power-off and the receiver restarts already set for the next trials. Alternatively you can load the configuration file shown above.
7 · Prepare the athlete
Mount the antenna high on the head (helmet/headband) with a clear view of the sky and the receiver in the belt bag; check that the RTK corrections (NTRIP) are connected and the satellites well tracked. There is no need to wait for a real-time fixed solution: the centimetre precision comes from PPK.
8 · Start recording with the LOG button
Once the stream is prepared (step 5), in the field you record without a PC with the LOG button — the outermost button, away from the USB-C (see Buttons):
- 1st press → starts the SBF recording at 100 Hz to the disk. The board's green LED goes from steady to blinking: the visual confirmation that logging is active.
- 2nd press → stops the recording and saves the trajectory; the green LED goes back steady.
Repeat for each athlete/trial.
9 · Download and process
At the end of the session remove the microSD (or download the files over USB), convert to RINEX if needed and run the PPK with RTKLIB-EX 2.5.0 — see Post-processing with RTKLIB.
Interface screenshots
No images of the orange interface are embedded here because the Septentrio web UI screenshots are Septentrio's property (the official guides linked above show them in full). Once you have your MSX connected, capture the real screenshots of your RxWeb and send them to me: I will insert them into these steps in place of the textual references.
Monitoring with the LOG button
In this application the athletes are monitored using the LOG button on the carrier — it is the inner of the two buttons (the one near the USB-C is the Reset; see Buttons: reset and LOG). The workflow is designed to be simple in the field and to move all the processing to a later stage:
- one press of the LOG button starts recording the trajectory (SBF stream at 100 Hz);
- a second press stops the recording at the end of the run;
- each run is saved as a trajectory (a raw-data file);
- at the end of the session, all the trajectories collected are post-processed together (PPK) to extract the parameters of interest.
Note
The LOG button controls the start/stop of a mosaic-X5 logging stream. The stream (SBF blocks and rate) is set up in the configuration; pressing the button merely activates/deactivates it in the field, without a PC. (button mapping to be confirmed in the MSX firmware)
Typical workflow
- Setup: antenna on the athlete, receiver powered and ready.
- Corrections active: check that the RTK corrections (NTRIP) are connected and the satellites well tracked (the final precision comes from PPK).
- Start: press the LOG button just before the start → trajectory recording begins at 100 Hz.
- Race: the athlete runs the lap; the system records position and raw measurements.
- Stop: press the LOG button again at the finish → the trajectory is saved.
- Repeat: repeat for each athlete/run; each run is a distinct trajectory.
- Post-processing: at the end of the session, download the files, convert
them to RINEX (
sbf2rin) and run post-processing (PPK) on all the trajectories, computing speed, acceleration, splits and path.
Tip
The 100 Hz SBF log is "raw": it lets you reprocess each run afterwards (PPK), getting the best trajectory quality regardless of any brief coverage drops during the run. This is why you record in the field and process everything afterwards.
Practical considerations
- Open sky: the athletics track is an ideal environment (few obstructions); avoid stands/roofing that limit the sky view.
- Bends and the athlete's body: movement and the body can shadow part of the sky → multi-constellation and a well-placed antenna help keep good satellite tracking.
- Weight and size: the mini carrier + Main is compact; keeping the weight of the assembly (receiver + antenna + battery) down matters so as not to alter the athletic movement.
- Synchronisation: to align the GNSS data with other sensors (photocells, IMU) you can use the module's PPS signal as a common time reference (availability on the mini carrier to be confirmed).
Warning
100 Hz should be used for this class of applications. For "slow" training or coarser analysis, 10–20 Hz reduce the files and the load while keeping more than adequate information.
How to run the tests
The protocol below is taken from the scientific study cited further down, adapted to the use of the MSX.
Equipment
- MSX receiver (mosaic-X5 module, SBF logging at 100 Hz);
- a lightweight multi-band GNSS antenna (e.g. tri-band helical);
- RTK corrections: a local base or an NTRIP service (station network);
- a mount to place the antenna high on the athlete's head (the head is a good proxy for the centre of mass) and a waist pack for the receiver;
- power (battery life at 100 Hz is on the order of ~1 hour).
Preparation
- Mount the antenna on the head (helmet/headband), firmly fixed to reduce micro-movements, with a clear view of the sky; the receiver in the waist pack.
- Start the RTK corrections (base/NTRIP). The centimetre precision is obtained in post-processing (PPK): there is no need to wait for a real-time fix (only required in static surveys).
- Full warm-up (~1 h) as per the race routine.
Recording and execution
- Just before the start press the LOG button → start the SBF log at 100 Hz.
- The athlete performs the maximal 400 m sprint (start from the blocks).
- At the finish press the LOG button again → the trajectory is saved.
- Repeat for each athlete/run.
Post-processing
- Download the files and (if needed) convert to RINEX (
sbf2rin), then run the PPK with RTKLIB-EX 2.5.0 (Tim Everett's fork) in Kinematic mode — see Post-processing with RTKLIB. - Filter the vertical position with a Butterworth low-pass (4th order, zero-phase, ~5 Hz cutoff): removes noise while preserving the kinematics.
- Derive the vertical velocity by differentiating the position.
- Detect each ground contact from the minima of the vertical velocity (the most accurate method according to the study).
- Compute, step by step: frequency SF = 1 / (step time), length SL = horizontal distance between two contacts, velocity = SL × SF.
- Plot SF, SL and velocity against distance → peak speed, fatigue decline, splits, asymmetries.
Tip
In post-processing (PPK) check the solution quality along the lap: any unresolved stretches (reduced precision) should be flagged in the analysis.
Field test
The system was tested in a real athletic training session on the track, with the MSX worn directly by the athletes. Both sprint runs (50 / 60 / 100 m) and the 400 m runs were timed, recording the raw GNSS data at ~100 Hz and then reconstructing — in post-processing — the trajectory, speed and stride parameters.
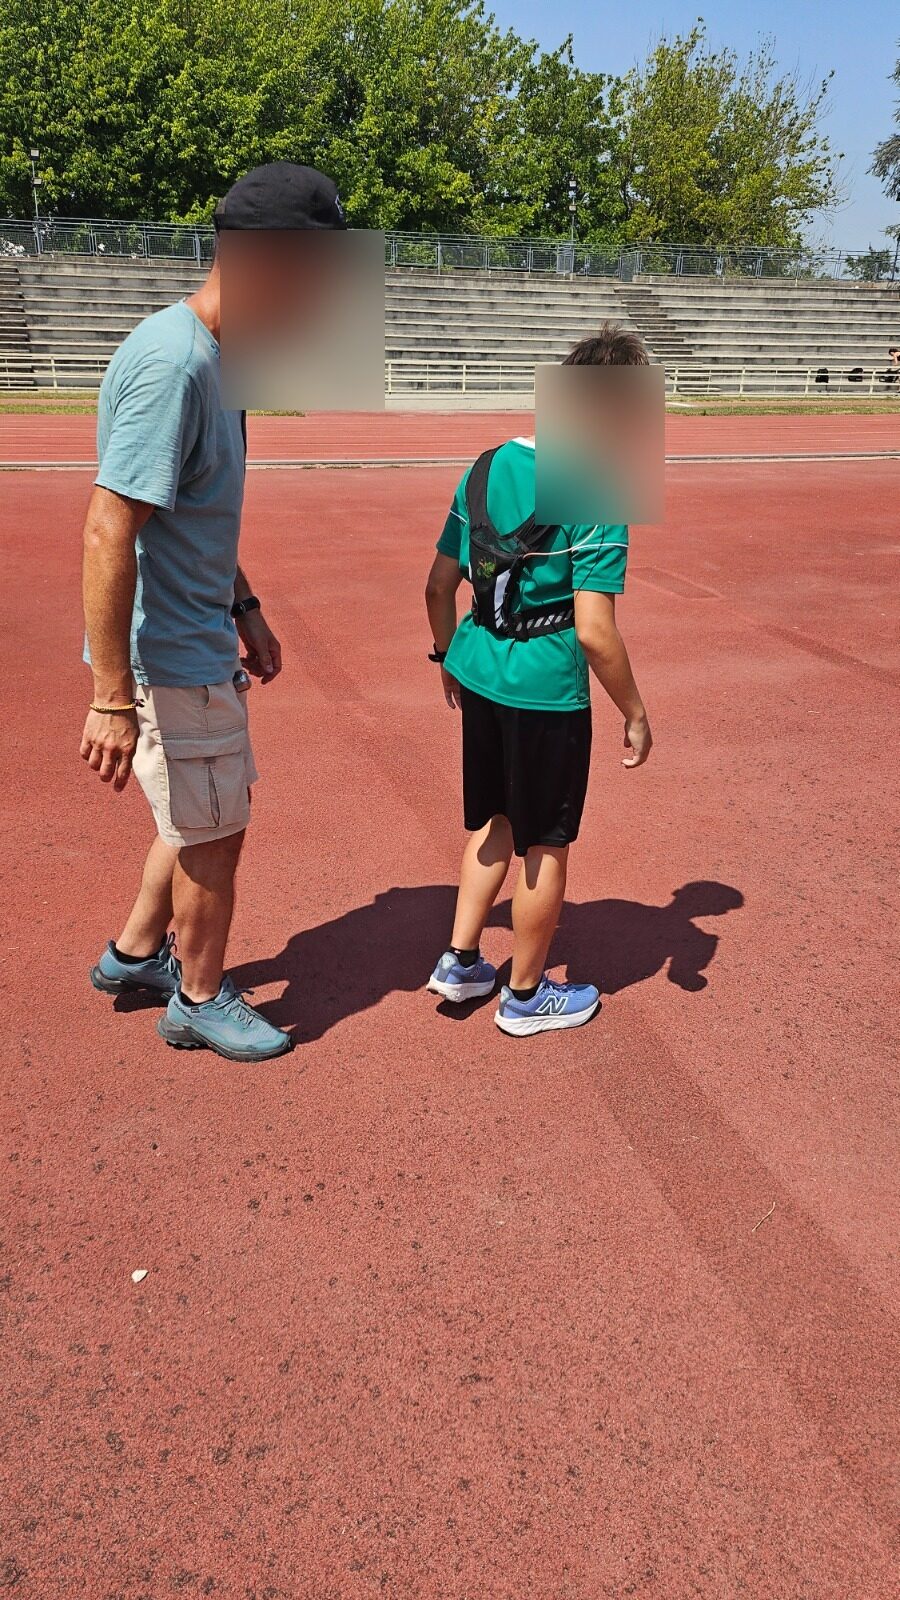
How the system is worn
- the helical GNSS antenna is fixed on a rigid support at the level of the upper back / base of the neck: a high position, with a clear sky view and a good proxy of the centre of mass;
- the MSX receiver and the power supply sit in a snug running vest / pouch that does not hinder the running motion;
- a coaxial cable connects the antenna to the receiver along the back.
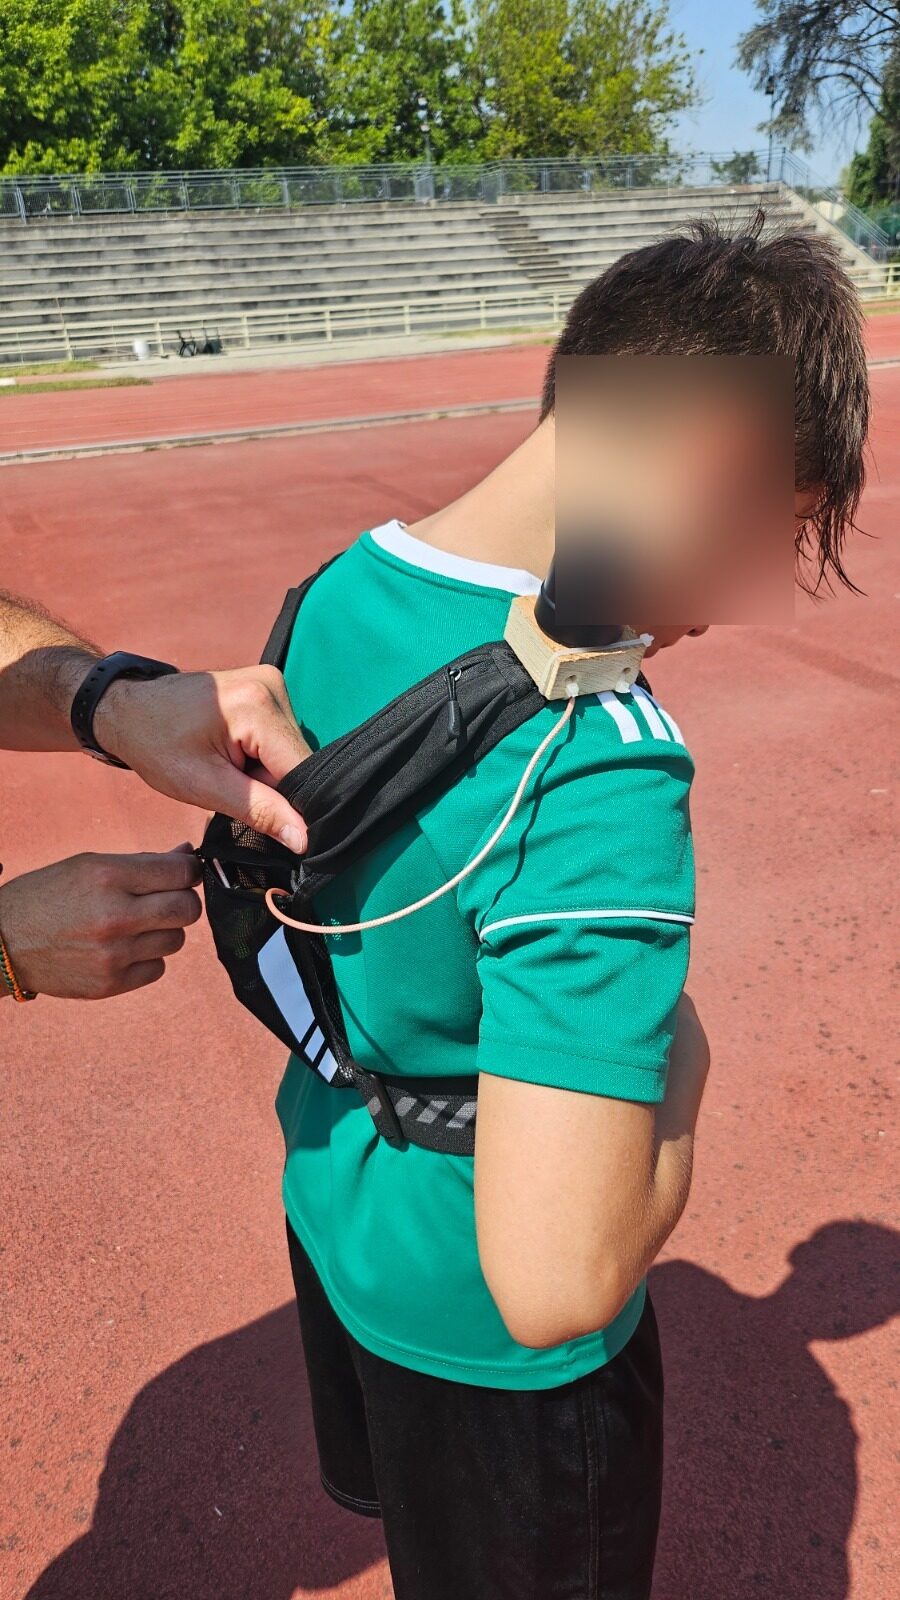
Session results
The raw data of every run in the session were processed:
| Quantity | Value |
|---|---|
| Processed GPS points | ≈ 248,000 |
| Sampling rate | 100 Hz |
| Processed runs | 6 (50 / 60 / 100 m sprints and 400 m) |
| Total distance covered | ≈ 2,870 m |
| Anomalous peaks excluded | 2.1 % (signal jitter, filtered) |
| Peak speed | 8 – 9.7 m/s |
| Average speed (running phase) | 5.5 – 6.2 m/s |
From each GPS point (planimetric coordinates x, y and elevation z) the trajectory, the instantaneous speed and the distance covered (cumulative odometer) were reconstructed. Speed was analysed both over time and against distance, applying moving averages at 1, 5 and 10 s to separate the single-stride detail from the overall trend of the run. The typical sprint profile clearly emerges: rapid initial rise, top-speed plateau and subsequent decline.
From the vertical oscillation of the centre of mass (the elevation minima at each foot strike) the individual strides were detected, yielding stride length (≈ 1.5 – 1.8 m), cadence (≈ 200 – 255 steps/min) and a symmetry index between alternating strides. On the 400 m runs the stride is very regular and symmetric (symmetry index ~99 %), consistent across all repetitions.
Limitations observed
The stride estimate (cadence, symmetry) is based on the vertical oscillation derived from the GPS elevation, which is the noisiest component of the signal: cadence and symmetry values must therefore be interpreted with caution. For precise biomechanical measurements (contact times, instantaneous cadence, reliable asymmetry) it is advisable to integrate inertial sensors (IMU) or force plates. The speed and distance quantities, on the other hand, are solid and fully adequate for the purpose of the analysis.
Scientific validation
The effectiveness of this approach — RTK GNSS with a 100 Hz mosaic-X5 module, head-mounted, to measure an entire 400 m step by step — has been demonstrated in a peer-reviewed study:
Onodera, K.; Miyamoto, N.; Hirose, K.; Kondo, A.; Kajiwara, W.; Nakano, H.; Uda, S.; Takeda, M. Running Parameter Analysis in 400 m Sprint Using Real-Time Kinematic Global Navigation Satellite Systems. Sensors 2025, 25, 1073. https://doi.org/10.3390/s25041073
The study uses a receiver with a mosaic-X5 module (USB-C, microSD, LED, logging button) — the same hardware base as the MSX — and validates the measurements against 3D video and IMUs. Main results:
| Parameter | Accuracy (best method) |
|---|---|
| Step frequency (SF) | RMSE 0.205 Hz · ICC 0.886 · R 0.92 |
| Step length (SL) | RMSE 0.143 m · R 0.80 |
| Per-step velocity | ICC 0.95 · R 0.95 |
| Step count (400 m) | 100 % correct |
| Total 400 m time | 99.95–99.99 % vs stopwatch |
The authors conclude that a single GNSS receiver (mosaic-X5, 100 Hz, with RTK corrections and kinematic processing) is a drift-free, single-sensor solution for step-by-step analysis of outdoor sprinting, superior to IMUs.
(Open access article, CC BY 4.0 licence.)